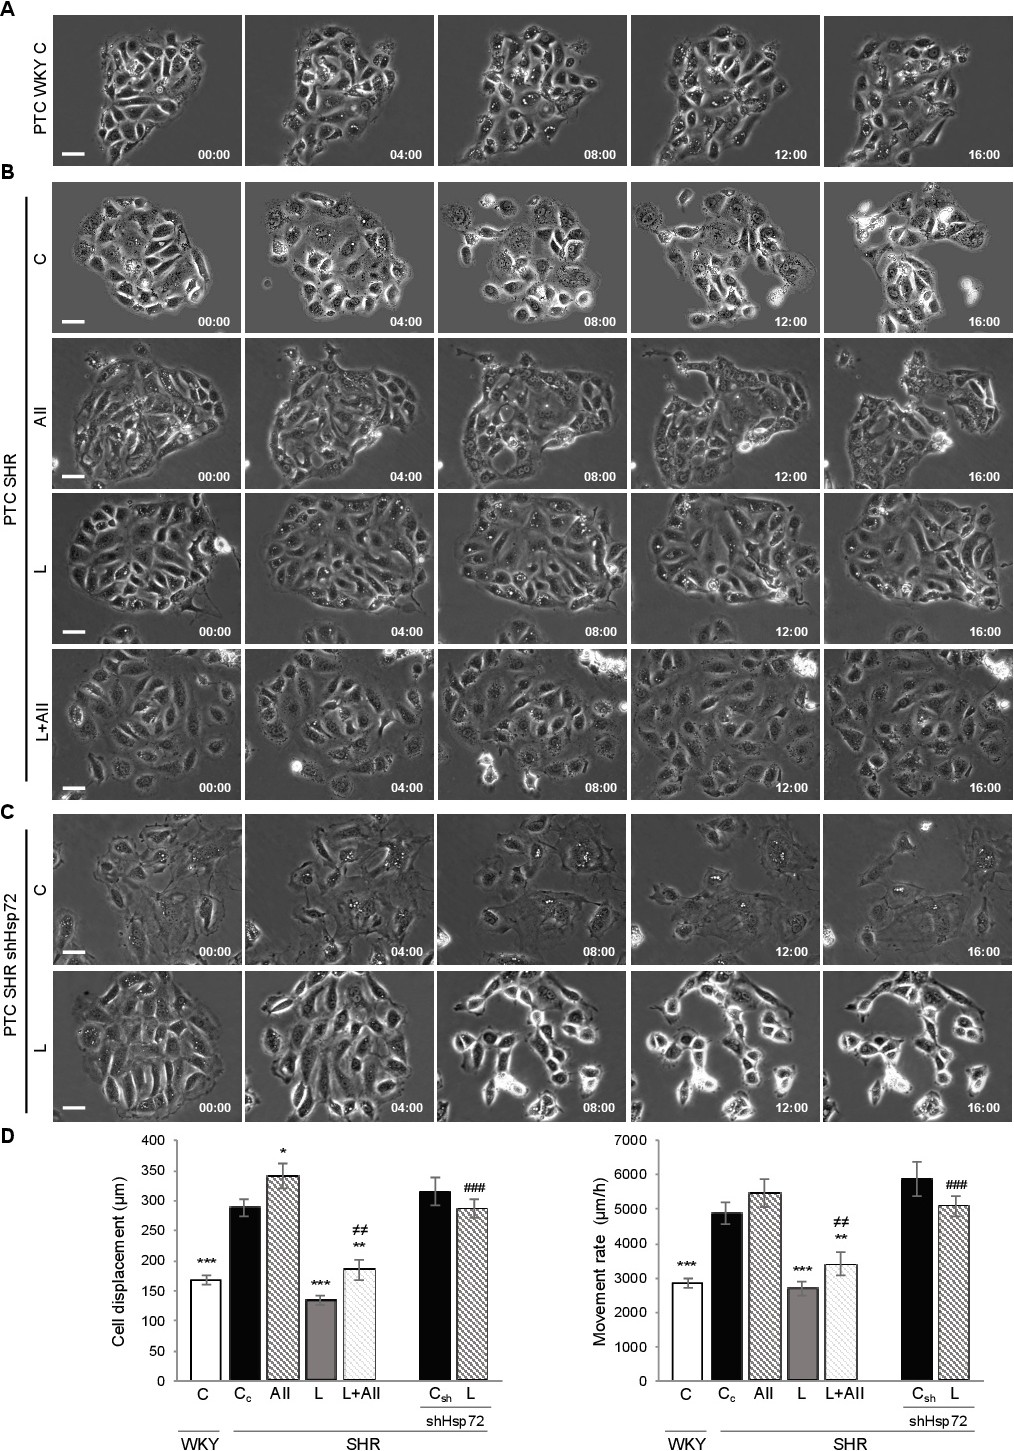
Fig. 5. Hsp70 within the Losartan effect on PTCs displacement and movement rate. Live cell time-lapse microscopy assay. PTCs were subjected to different treatments and analyzed by phase contrast in live time-lapse microscopy from 0 to 16 h treatment; images were acquired every 15 min using a Nikon Eclipse TE 2000-U inverted microscope. Representative images of A) WKY PTCs (C), B) SHR PTCs (Cc), (AII), (L) and (L+AII) treated cells or C) shHsp72 knockdown SHR PTCs (Csh) and (L) treated at the beginning of treatment (00:00) to 16 h. Lower right of each panel: average time (h:min). Bar: 50 µm. The average of cell displacement and movement rate (D) were calculated by analyzing 3 movies, by following 60 cells in each treatment condition. Bars means ± SEM, n=3. *p≤0.05; ** p≤0.01, *** p≤0.001 vs SHR PTCs control group (Cc). ### p≤0.001 vs SHR PTCs (L). ≠≠ p<0.01 vs SHR PTCs (AII).